KV Cache Reduction, Measured on One A100 — Part 1: The Twelve Techniques Don't Pay in the Same Currency
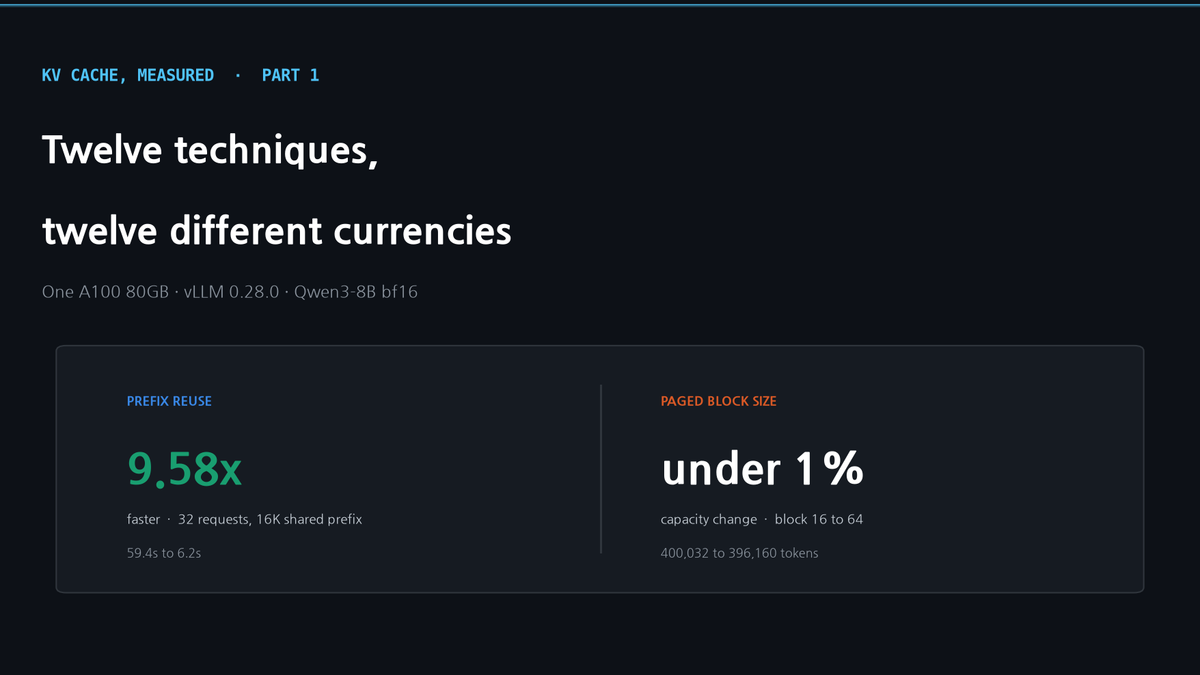
Every list of KV cache techniques presents a dozen of them as peers. On one A100 the spread is enormous: prefix reuse cut a shared-prefix workload from 59.4s to 6.2s, while tuning the paged block size moved capacity by under 1%. The reason you cannot rank them on one number is that they pay out in different units.
KV Cache Reduction, Measured on One A100 — Part 1: The Twelve Techniques Don't Pay in the Same Currency
Lists of KV cache techniques circulate constantly, and the good ones end with a caveat worth keeping: these methods do not all compress the cache. Some shrink it, some reduce reads, some remove duplicated computation, some only change where the bytes live.
That caveat is correct. It is also where the lists stop. They name twelve levers, lay them out as peers, and never say what any one of them is worth. So I put them on one A100 and measured.
The headline is not a ranking. It is that a ranking is the wrong shape for this question. Two of the twelve landed on opposite ends of anything you could call a scale — one cut a workload from 59.4 seconds to 6.2, another moved capacity by less than one percent — and the two are not even denominated in the same unit. This part sets up the measurement so the numbers in Part 2 mean something. Part 3 covers what breaks when you combine them.
The rig, and the one number that makes comparison possible
One A100 80GB PCIe, driver 535.288.01, vLLM 0.28.0, Qwen3-8B with bf16 weights, max_model_len 40,960, gpu_memory_utilization 0.90.
Everything below is anchored to bytes per token, because that is the quantity the architectural techniques attack. For Qwen3-8B the model config gives 36 layers, 8 key-value heads, head dimension 128, keys and values, two bytes each:
36 × 8 × 128 × 2 × 2 = 147,456 bytes per token = 144 KB
At that rate the engine reported 400,032 tokens of GPU KV cache, and 9.77 as the maximum concurrency for 40,960-token requests. The arithmetic closes exactly: 400,032 × 147,456 bytes is 54.94 GiB, which is the figure vLLM printed for available KV cache memory. That is worth doing once by hand, because it means capacity claims later in the series are checkable rather than reported.
This rig is the same one behind two posts I have already published — the TurboQuant vLLM benchmark and the hybrid Mamba measurement. Their bf16 baselines were 396,192 tokens (9.7 concurrent) and roughly 400,000 (9.8 concurrent). Today's 400,032 and 9.77 sit inside one percent of both, which is the only reason rows from those posts can appear in the same table as new ones.
Four things a "KV cache technique" can actually do
Sorting the twelve by mechanism rather than by name gives four groups.
Fewer stored bytes. GQA and MQA, cross-layer sharing, multi-head latent attention, sliding-window attention, hybrid Mamba layers, KV quantization, token eviction, compressed attention. Eight of the twelve.
Less duplicated computation. Prefix reuse. One.
Fewer reads. Query-aware sparse reads. One.
Different residency or layout, same bytes. Paged allocation, offloading. Two.
The first observation is that the lists look more varied than they are. Two-thirds of the items do one thing: make each token cost less to store. They differ in how — fewer KV heads, fewer layers holding state, fewer bits per value, fewer tokens retained — but they all move the same term in the same product, and stacking two of them multiplies rather than adds.
The second observation is what motivated the whole series. The group with one member in it is the one that produced the largest number I measured.
Two measurements that reorder the list
Prefix reuse: 1.0x to 9.6x, depending entirely on the prefix
The workload is the shape an agent or a RAG service actually has: 32 requests that share a long prefix and differ in a short suffix. Each request carries a 256-token unique tail and generates 64 tokens. Every request is new — nothing has been asked before — so this measures reuse within a batch, not a repeated query.
| Shared prefix | Prefix caching off | Prefix caching on | Speedup |
|---|---|---|---|
| 0 tokens | 1.378s | 1.389s | 1.00x |
| 1,024 | 3.916s | 1.647s | 2.38x |
| 4,096 | 12.484s | 2.512s | 4.97x |
| 8,192 | 25.900s | 3.652s | 7.09x |
| 16,384 | 59.386s | 6.199s | 9.58x |
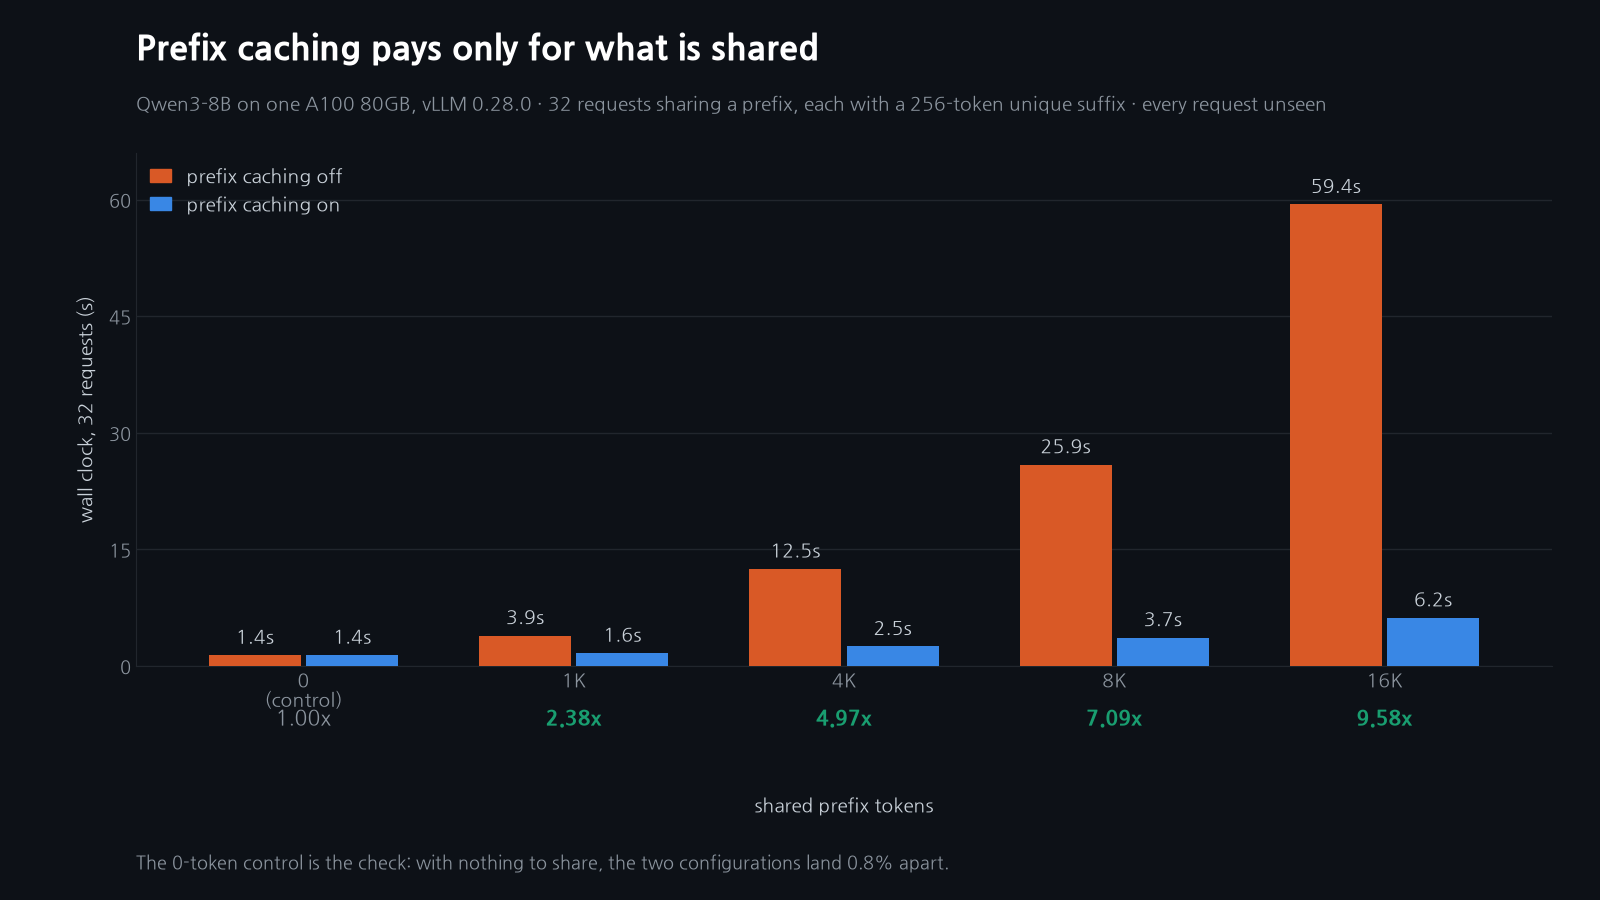
The first row is the control and it is the reason I trust the rest. With no shared prefix there is nothing to reuse, and the two configurations came within 0.8% of each other. Everything below that row is the mechanism, not warmup or measurement drift.
With caching off, prefill throughput stayed flat between 8,967 and 11,156 tokens per second across every prefix length, which is what real computation looks like. With caching on it climbed from 5,898 to 85,903 tokens per second. That number is not the GPU getting faster. It is the denominator counting tokens the GPU never processed.
The dependency is the part to carry forward: the multiplier is a function of how much of each request is shared. At 16K shared out of 16.6K total it is 9.6x. At zero shared it is exactly nothing. Anyone quoting a single figure for prefix caching is quoting their own workload.
Paged allocation: the block size buys nothing
block_size | GPU blocks | KV tokens | 40K-token requests |
|---|---|---|---|
| 16 (default) | 25,002 | 400,032 | 9.77 |
| 32 | 12,381 | 396,192 | 9.67 |
| 64 | 6,190 | 396,160 | 9.67 |
The whole range is inside one percent. This is not an argument against paged allocation, which is why fragmentation is not eating a third of the cache in the first place — it is an argument that you already have the win by running vLLM, and there is no second helping available by tuning the knob. The lists put this item next to items worth multiples. It is not their peer.
Why one column cannot hold all twelve
Here is the trap I nearly walked into. Having measured 9.58x for prefix reuse, it is tempting to file it next to the capacity multipliers from the earlier posts on this rig: fp8 KV at 2.0x capacity, TurboQuant 3-bit at 3.5x, hybrid Mamba at 3.6x concurrency. Prefix reuse would top that table.
It does not belong in that table. 9.58x is a wall-clock speedup on a prefill-heavy workload. 3.5x is a capacity multiplier — how many tokens fit. They are different quantities with different units, and a technique that wins on one can be worth nothing on the other. Quantization at 3.5x capacity cost roughly half the batch throughput on this card. Prefix reuse changed capacity by zero.
So the twelve do not sort into a leaderboard. They sort into what they pay you in:
| Pays in | Techniques | Measured on this rig |
|---|---|---|
| Tokens that fit | GQA/MQA, MLA, cross-layer, hybrid, quantization, eviction, sliding window | 2.0x to 3.5x (quantization, cited), 3.6x (hybrid, cited), 4x (GQA, computed) |
| Time on shared-prefix work | Prefix reuse | 1.00x to 9.58x (measured today) |
| Memory traffic per decode step | Sparse reads | not measured |
| Nothing, once you already have it | Paged block size | under 1% (measured today) |
The GQA row is computed, not measured, and I want the label on it. Qwen3-8B runs 32 query heads over 8 KV heads. Widening it back to 32 KV heads gives 589,824 bytes per token, and the same 54.94 GiB then holds 100,008 tokens instead of 400,032 — 2.44 concurrent 40K requests instead of 9.77. A 4:1 group ratio buys exactly 4x, which is the one place in this series where the arithmetic is the whole story and no measurement is needed.
The cliff that Part 3 is about
One more result, because it changes the advice rather than adding to it.
I built a working set of 64 distinct 8,192-token documents, 540,672 tokens against a 400,032-token cache, and ran through all of them twice. Three-quarters of that working set fits in the cache, so if reuse degraded in proportion to the overflow, most of the second pass should have been served from it.
First pass 49.458 seconds. Second pass 49.652. A speedup of 0.996x, which is to say none at all.
Exceeding capacity by 35% did not cost 35% of the benefit. It cost all of it. Every document had been evicted before it came around again, so the entire second pass was recomputed from scratch. The useful form of the advice is therefore not "turn on prefix caching" but "keep the working set inside the cache," and those two sentences stop being the same sentence at the boundary I just crossed.
What I could not measure
Offloading is the twelfth item and I have no number for it. vLLM 0.28.0's SimpleCPUOffloadConnector crashed in all eleven configurations I tried — eager and lazy mode, 8GB through 64GB of host capacity, working sets from 16% to 135% of GPU cache. The connector initialized cleanly every time, logging its block allocation, then segfaulted during generation. The single run that finished its generations segfaulted at teardown instead.
I could not determine the cause. It is not the block-size mismatch reported in vLLM issue #56396, since Qwen3-8B's 36 full-attention layers form a single KV cache group and the scheduler and hash block sizes both resolve to 16. My kv_role matched what the connector's own source specifies. I could not get a stack trace, because vLLM installs its own SIGSEGV handler and the crash occurs in a separate engine process.
What I can say is narrow and I will not stretch it: on this rig, with this version, I could not make CPU KV offloading run. Twelve pull requests and issues touching this connector were opened upstream between September 1 and 11, 2026, including one crash report with a different cause. That is a feature under construction, not a verdict on the idea.
Next
Part 2 puts the engine-side axes on the same table — prefix reuse across workload shapes, quantization presets, block size, and whatever offloading does once it runs. Part 3 is the combinations: eviction against prefix reuse, the capacity cliff above, and what to enable for four workload shapes.
If you want the next part when it lands, the subscribe form is at the bottom. The reason to take it is built into the format: when a measurement contradicts something I wrote here, you will read it in the next issue.
Rig: A100 80GB PCIe × 1, driver 535.288.01 / CUDA 12.2. Software: vLLM 0.28.0 (+cu129), transformers 5.16.1, Qwen3-8B bf16, max_model_len 40,960, gpu_memory_utilization 0.90. Prefix workload: 32 requests, 256-token unique suffix, 64 output tokens, greedy. Measurement scripts and raw JSON are in drafts/.
Subscribe to Newsletter
Related Posts

Paper of the Week #3 — Half the FLOPs Is Not Half the Time
One integer halves a fine-grained MoE's expert compute (arXiv 2609.04575) and its Table 5 replicates on one A100 to within a point. The paper never reports time, so I measured it: nothing in HF transformers, nothing at batch 1 in the vLLM you run today, 1.35x at batch 8. Plus the OLMoE control and the iso-cost harness control promised in issue #2.
The paper stopped at half the experts. A quarter loses four points instead of thirty, and a model trained without renormalization tells you why.
Two cells arXiv:2609.04575 never ran: k₁=2 and k₁=3 on Qwen3.6-35B-A3B, and the whole k₂ trick on OLMoE, which was trained without renormalization. The second one is a clean test of the paper's mechanism.
One integer halves MoE expert compute. We measured the speed the paper didn't: free at batch 8, not at batch 1.
We reproduced Table 5 of arXiv:2609.04575 on one A100 and measured the throughput the paper leaves out: nothing in HF transformers, nothing at batch 1 in stock vLLM, 1.35× at batch 8.